What Analytics Metrics Should You Be Monitoring?
Roy Bielewicz
What Analytics Metrics Should You Be Monitoring?
When was the last time you looked at your company’s website data? If you’re like many, you probably don’t with any regularity, or at all. In some cases that may be because your agency or marketing team provides reporting related to your marketing programs, and sometimes because you’re just not sure what you should be looking for.
We’ll take a look at some of the most common metrics, and talk about what you should be looking at, and what metrics aren’t that useful. Note, we’ll be using terminology that is typically associated with Google Analytics since it tends to be the most widely used analytics platforms. The concepts will be the same though, if you’re using Adobe Analytics, Kissmetrics, or some other website analytics platform.
Actionable Metrics
Before we dive into details, I’ll share one of our guiding mantras when it comes to data: If it’s not actionable, then it’s only interesting.
What’s that mean? Well, fundamentally, we ask the question “can this data be acted upon to create a better user experience, increase conversions, improve engagement, and ultimately drive more business?” If not, then why are you tracking it? Is it a vanity metric, or is it just something that’s always been tracked?
Getting caught up in unactionable data is a great way to head down the path of
data paralysis. Data paralysis is when you have so much data, so many reports, that you have a hard time making sense of it and making decisions. The opposite of what you need data for.
So, with that in mind, let’s look at some of the data that you should, and maybe shouldn’t, be looking at in your website analytics tools.
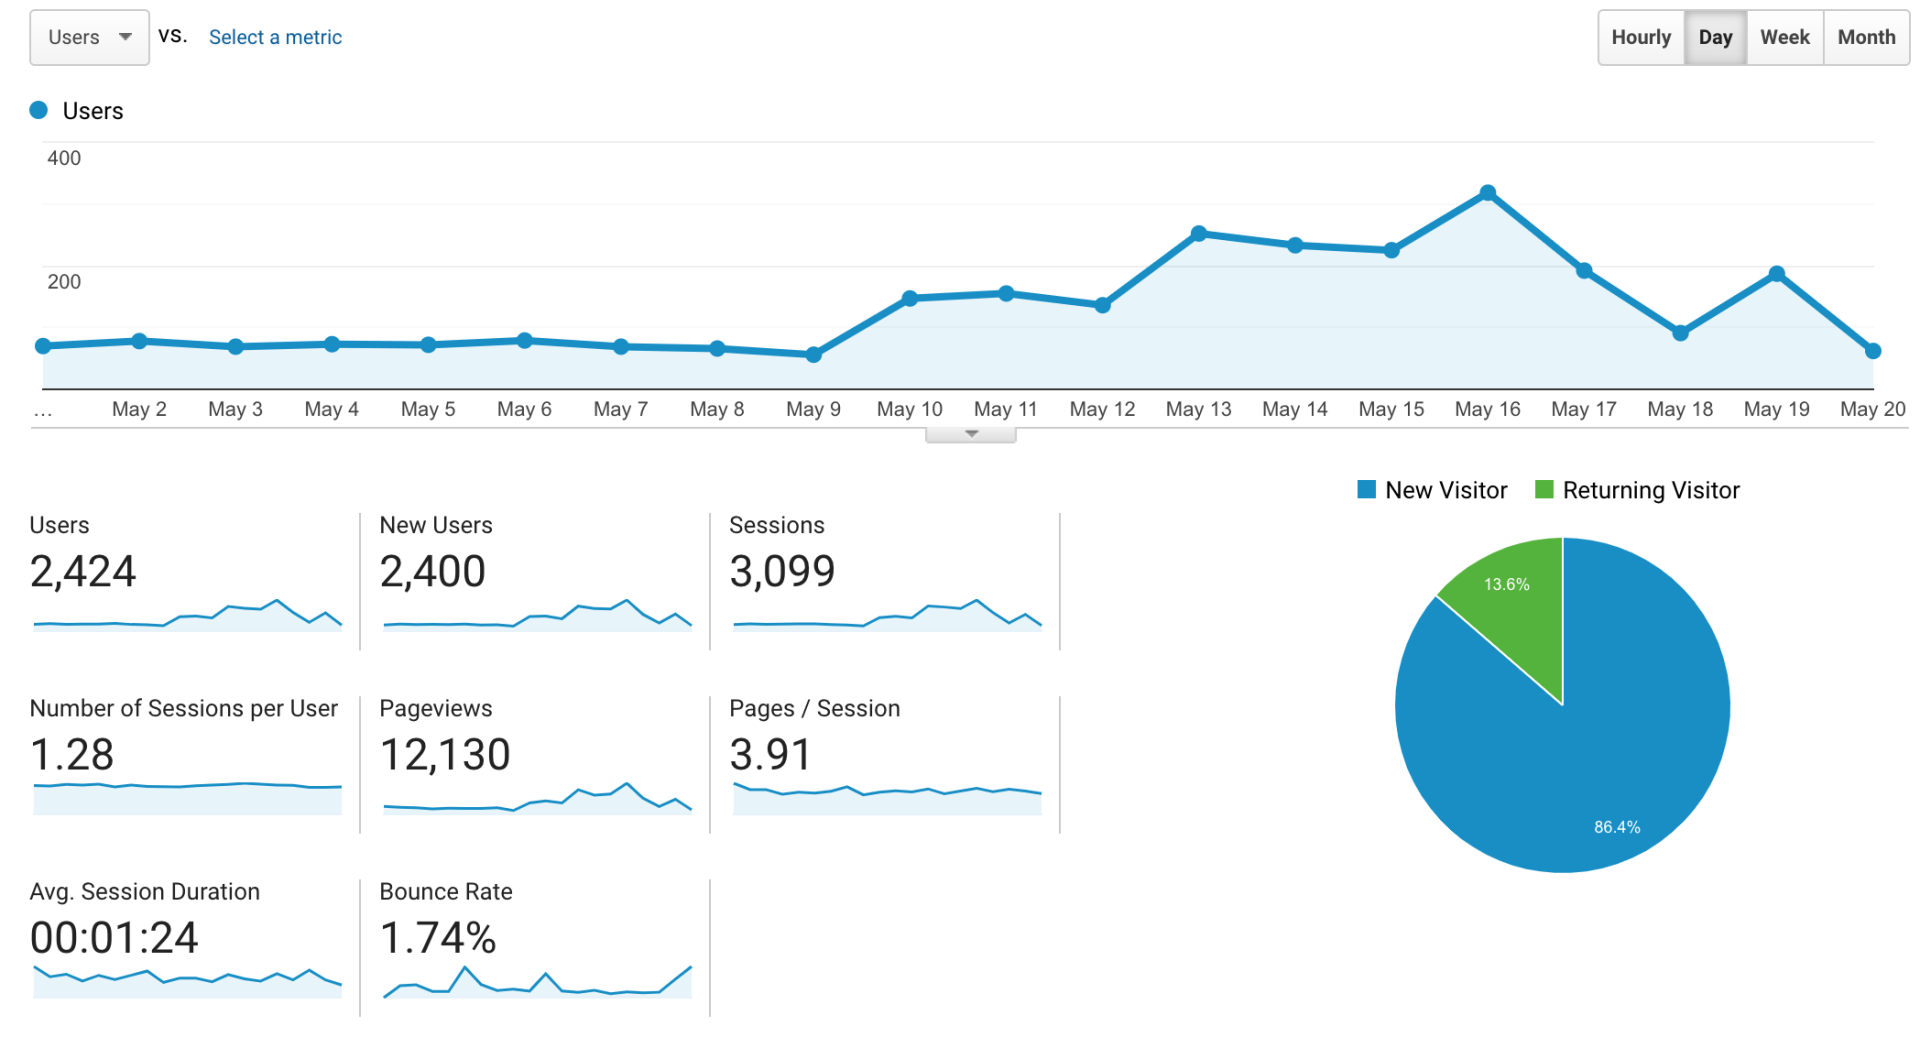
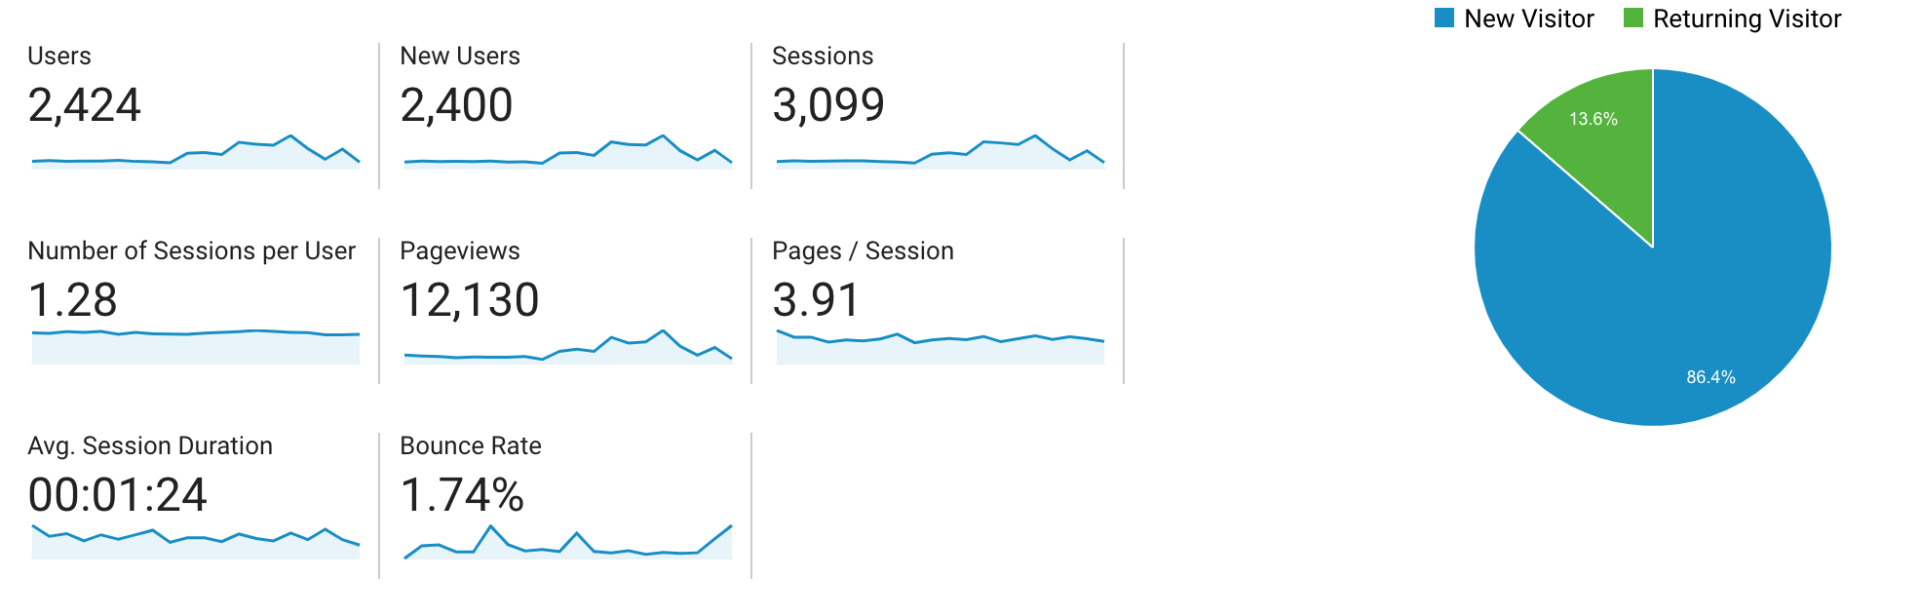
Traffic/Audience
Website “traffic” or “visitors” is one of the most frequently used metrics. And while it can be an important metric, informing you about the volume of traffic that your site is receiving, it’s also something of a vanity metric.
How so? Well, it’s something agencies and marketing teams can point to to say “Hey, we’ve grown website traffic by XXX%!!!” Ok, great. Is that traffic driving conversions? Is it the right traffic? Case in point: our own site traffic. There are other companies whose names include “Apotheca”. And one of these is in the CBD/pharma field. We’ve written blogs about
selling
CBD products. And we’ve seen a decent amount of traffic that comes from people searching for that other company, which becomes obvious when we drill down in the search terms used to get to our site.
So, is this traffic useful to us? Is it our target audience? Should we thump our chests that traffic grew month-over-month and year-over-year. Probably not.
So as you can see, in cases like this, just looking at traffic can be misleading, because it’s not a barometer of how our marketing programs are performing and it’s definitely not leading to conversions.
Traffic also gets more confusing when people incorrectly mix and match the use of “sessions” and “users” in their reporting.
A session, as Google defines it, is: “A session is a group of user interactions with your website that take place within a given time frame. For example a single session can contain multiple page views, events, social interactions, and ecommerce transactions.”
A user is defined as: “Users who have initiated at least one session during the date range.” That portion about the date range is the important part. Because unique users during a day is going to be a different metric than unique users for the month. We’ve encountered companies that report on users on a weekly basis. They then add those weekly users together for their monthly reporting. This is not going to be accurate, because that user may have come back multiple times over the month, artificially inflating the offline reporting.
We won’t delve into them in this article, but within audience reporting are some more advanced views, such as new versus returning users, user segments, demographics, etc. These can be important for deep dives into your user data, but we’ll look more closely at these in the future.
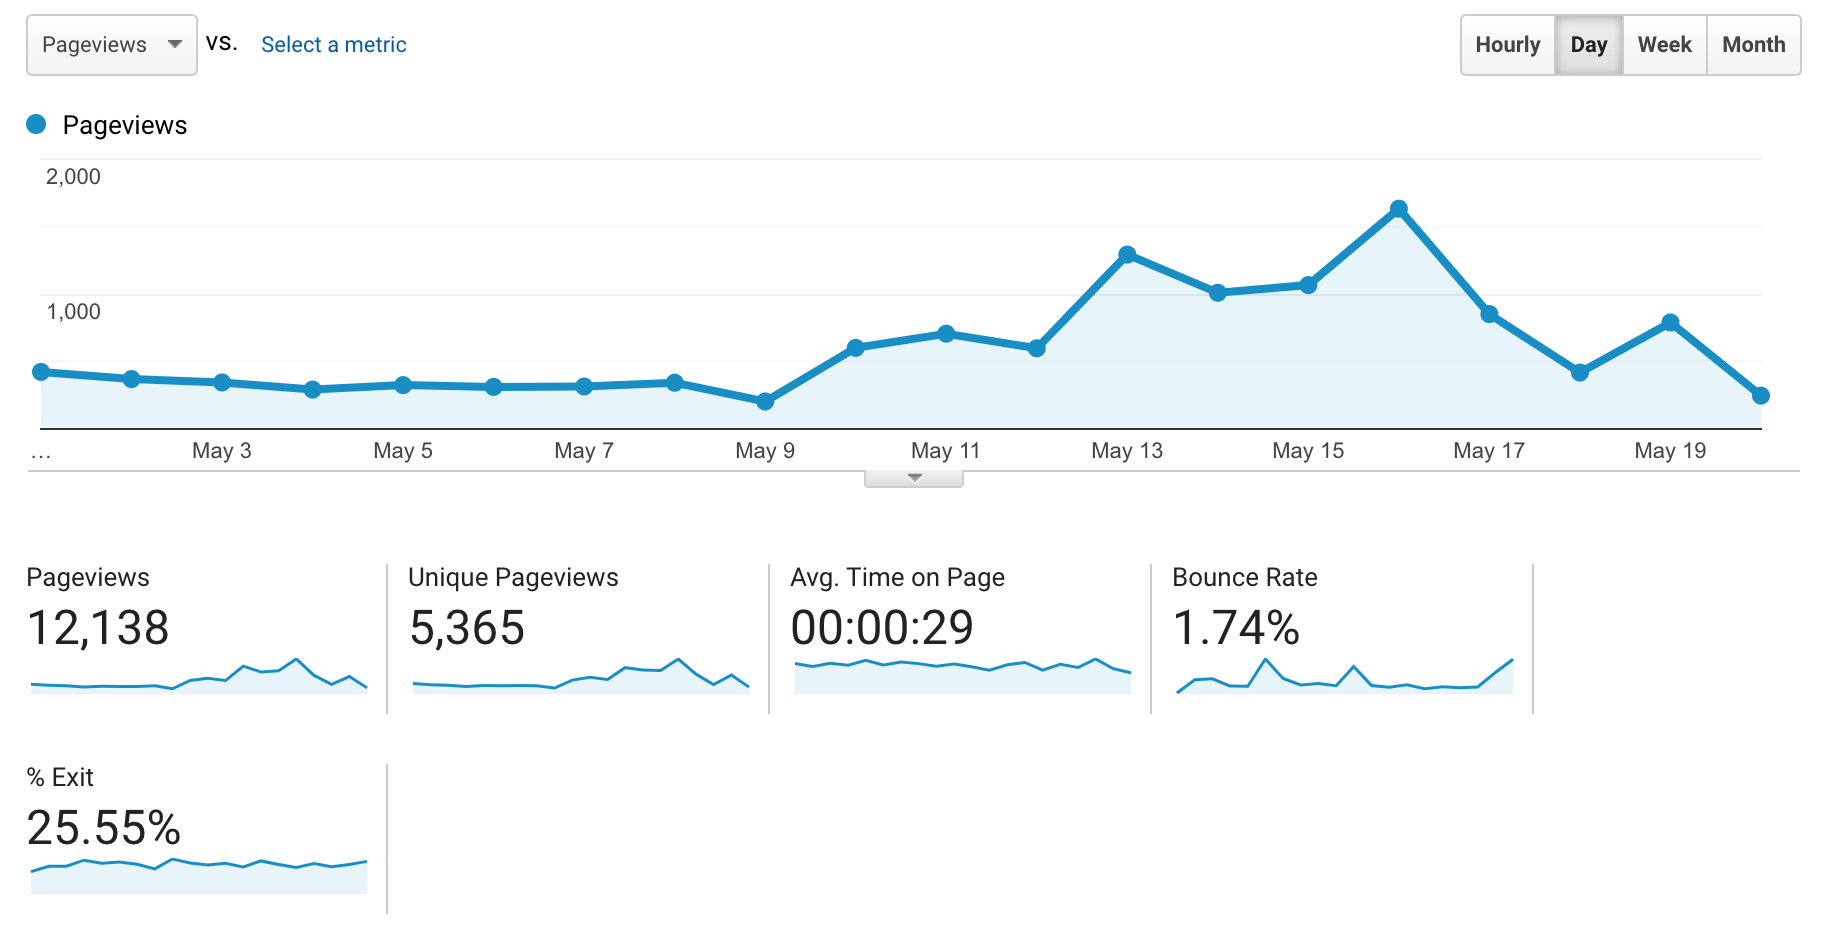
Behavior
Google’s Behavior Overview tab has some interesting data… Notice, it’s interesting, but not always actionable. This behavior reporting includes metrics like pageviews, unique pageviews, time on page, bounce rate, and exit rate.
Much like traffic, some companies get really caught up in time on site and pageviews. “Our users averaged 10 pageviews and stayed on the site for 20 minutes!” Sounds great, right? And it could mean that your audience is extremely engaged with your content. But it can also mean that your site is a usability nightmare and it’s extremely difficult to find what you’re looking for. Much like short visits and fewer pages may point to very targeted use of
landing pages, and great usability, and a better user experience.
Viewed in isolation, these metrics don’t tell you a lot. Combined with other user behavior, like site navigation, click mapping, and A/B testing, they can definitely be useful, but we generally don’t include them in most dashboards because they don’t tell a full story, and typically aren’t actionable by themselves. (One caveat to this, however, is when you see spikes or drops in these metrics over time. If you see a sudden drop in pageviews that’s dramatically different from historical trends, it can point to a potential problem that may need further investigation.)
Of all of the main behavior metrics we typically find bounce rate is the most useful, but mostly at the individual page level. Bounce rate is defined as the rate at which users leave your site after only viewing one page. High bounce rates on landing pages can be indicative of content that isn’t what the user expected, slow load times, or poor usability. As with the other behavior metrics, it can help to indicate that something needs further investigation or testing.
We particularly like using this with landing pages for advertising, as well as SEO. A higher than normal bounce rate on these pages can help to point to the need for enhancements, refinement, or expansion, thus making our marketing more profitable.
Note: Site content, site flow, site search, and events, also fall under this category, and they can all be incredibly useful, but generally don’t make an appearance in weekly dashboards and reporting. We’ll dive into those metrics and how to use them in subsequent articles.
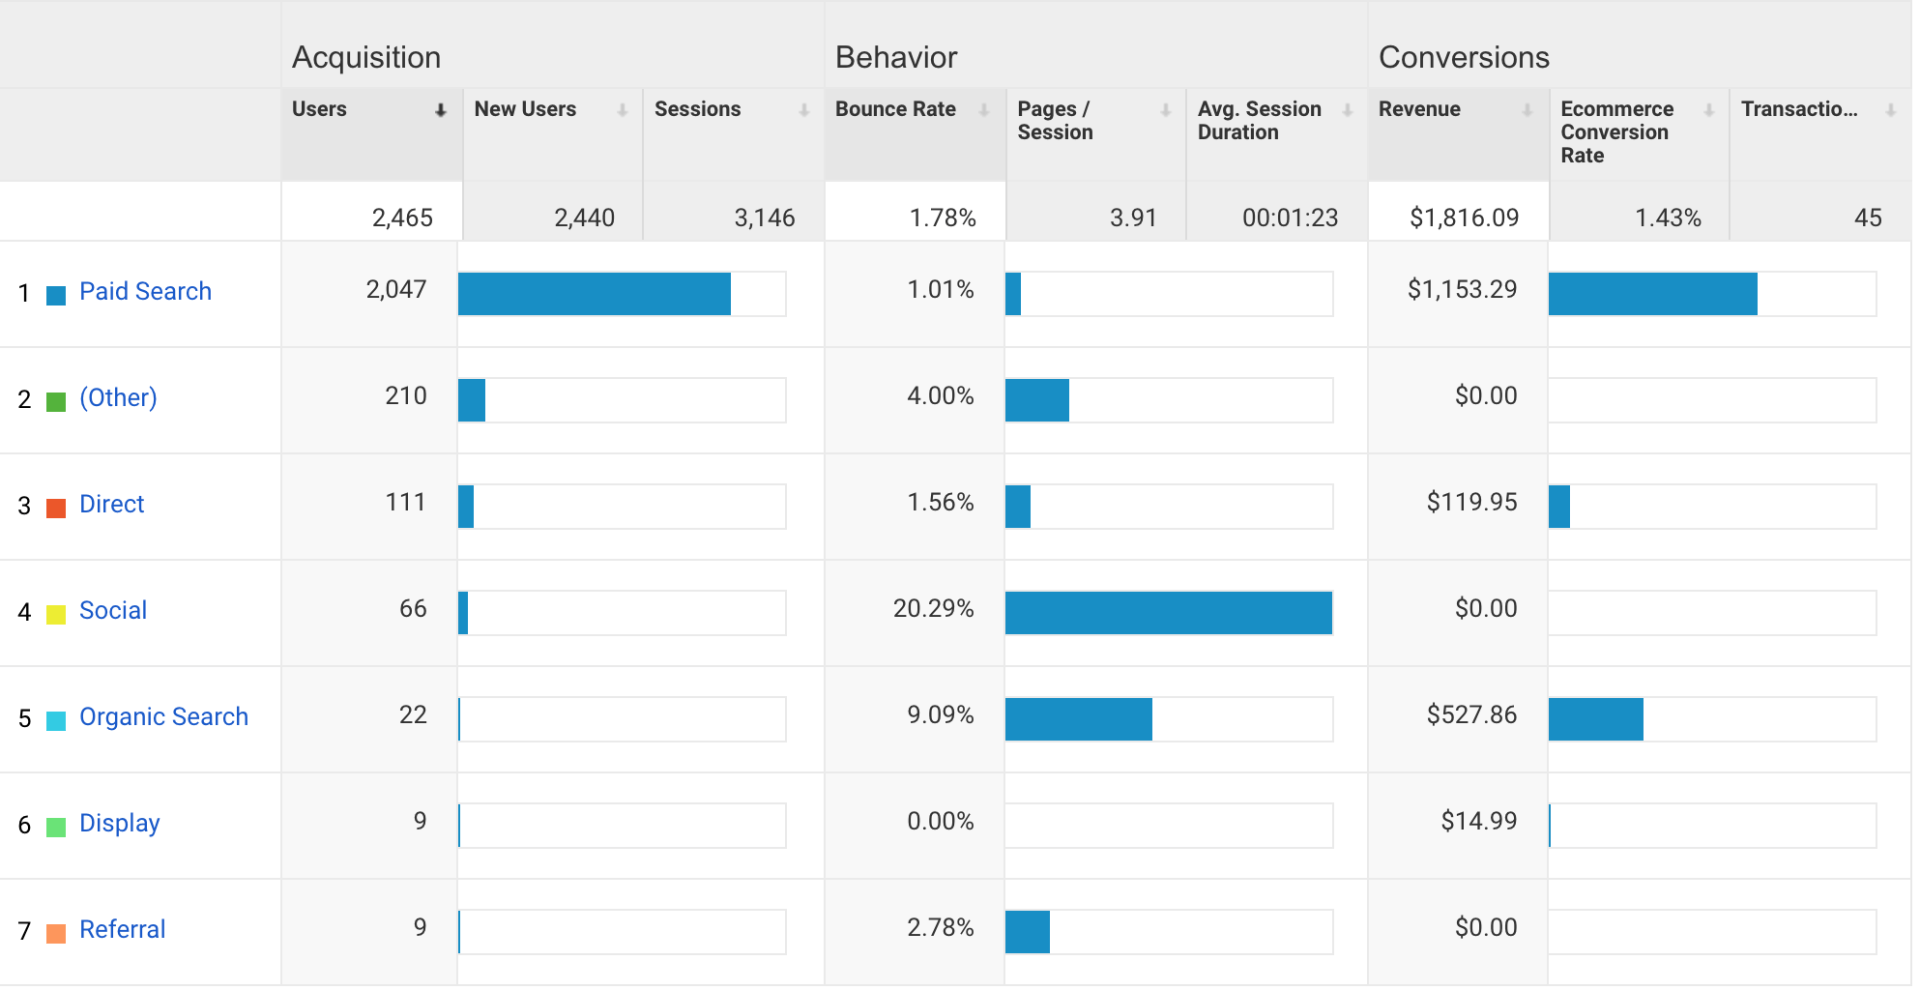
Acquisition
From a marketing perspective, the acquisition section of Google Analytics is extremely important. This is where you’re going to see not only traffic that is coming from your various marketing channels and campaigns, but also conversions, revenue, etc.
From a high level, you’ll want to be looking at not just the traffic that each marketing channel is driving (see traffic above), but rather the conversion metrics. For retail sites, this would be transactions, revenue, and conversion rate for each channel. For non-retailers, your conversion metrics are what you have defined (see our blog on conversions), and can have a dollar value associated with them.
We highly recommend that you take some time to integrate your Google Search Console and Google Ads data with Google Analytics, since these will make your acquisition reporting much more effective. You’ll be able to drill down into your Ads campaigns (cost, keywords, etc.), as well as your organic keyword performance.
You’ll note that on the “Overview” in acquisition, that Google buckets these campaigns automatically using it’s best guess as to where traffic and conversions should be credited. You do have some control over this in the GA admin and can define different channels. And of course, you can and should be adding UTM tracking to your campaigns so you can see more granular detail about your marketing campaigns, all the way down to the creative version.
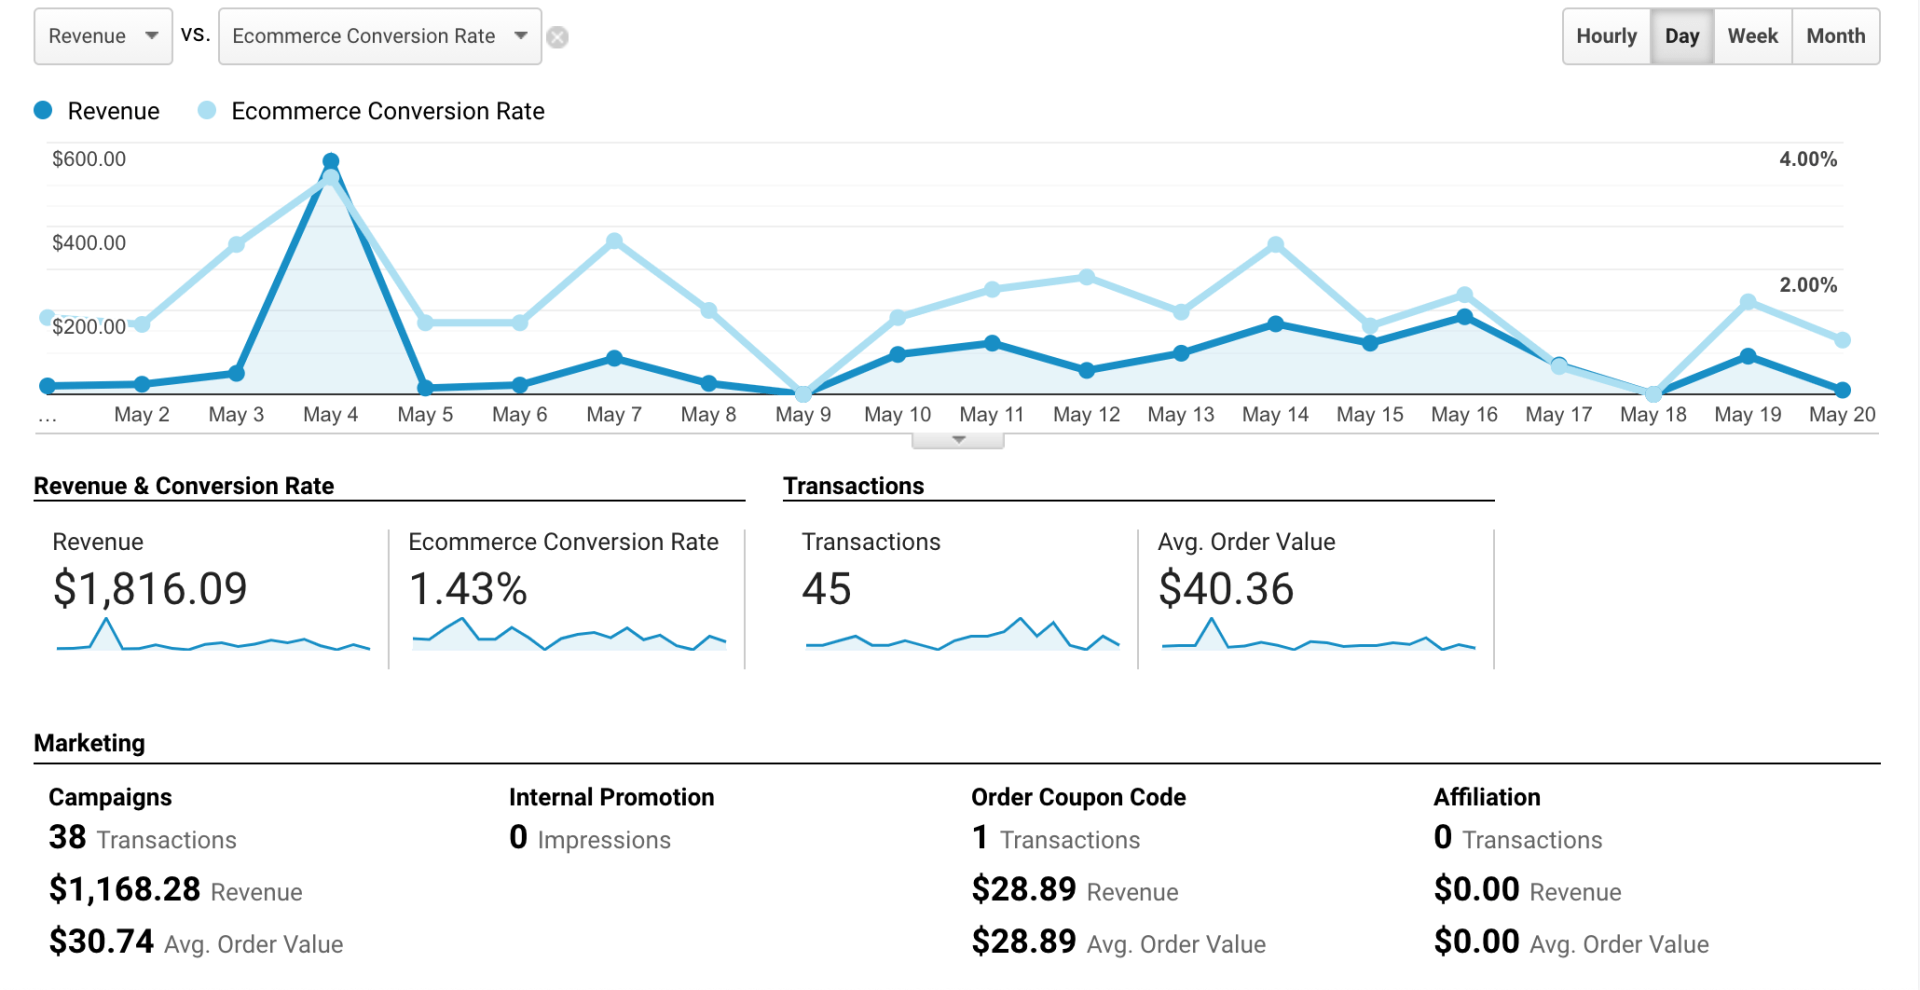
Conversion
The conversion section of GA gives you an overview of not only direct conversions like sales, leads, etc., but also goals. Depending on your business, you may have a combination of these that are important to monitor.
While this section is a great barometer about what’s happening on your site (e.g., you can quickly see overall sales, conversion rate, leads, email signup, etc.), I would argue that it’s less actionalable than the marketing acquisition reports. BUT, when reporting to your boss, they’ll want to see these overall numbers to understand how the site is performing.
If you want more insight into the different types of conversions, check out our blog:
What is Conversion?
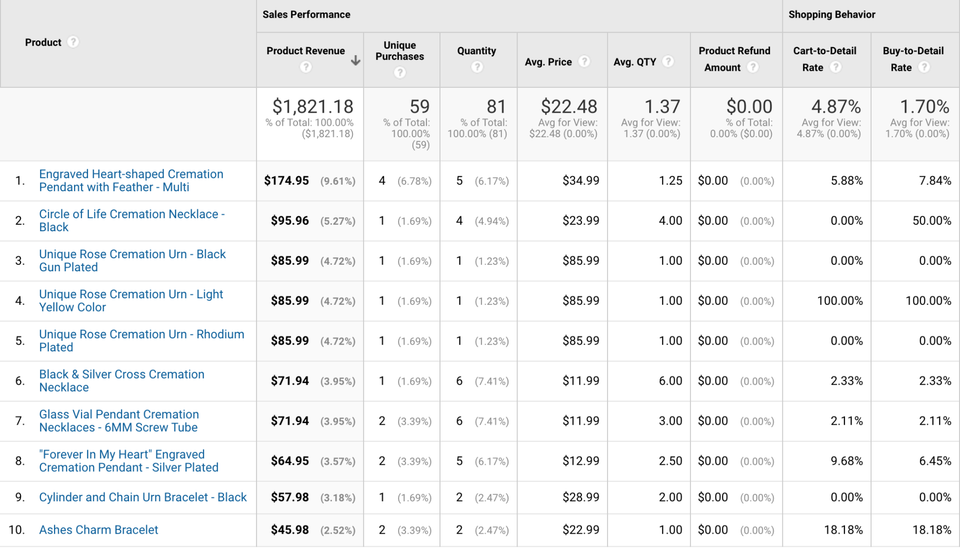
For retailers, we find that one section of the conversion reporting is often overlooked, and that’s product performance. This report is incredibly useful for your merchandising, stock estimation, etc. You can very granularly see what products are selling, how much they’re contributing to the overall revenue, and how they impact your AOV (average order value). You can also drill down by secondary dimension and look at what marketing channels are driving these sales.
Conclusion & Some More Considerations
Ok, so we know we’re just scratching the surface with how powerful analytics can be for not only measuring, but optimizing your website’s performance. There are a couple of important considerations we’d like to point out that sometimes get overlooked when it comes to analytics data.
GA data is directional. For very large sites, some of the data in GA is sampled. That means that Google isn’t reporting on every single visitor, but modeling how many they anticipate based on past performance. You’ll need to pony up $100K per year for the paid version to get real time non-sampled data in some of the high level reporting.- GA isn’t accounting data. GA doesn’t account for cancellations, returns, refunds, etc. So that revenue number is “directional” in that it gives you a good idea about performance, but isn’t going to be the same as your accounting data.
- It won’t match with other tracking. Ever. This is a common issue, and it has to do with a number of factors including where the code is fired on the site, how quickly the code loads on your site, and how each tool calculates certain metrics. But what this means is that Google Ads clicks, Facebook metrics, and certainly other analytics tools like Adobe, and Kissmetrics, will never, ever, consistently have the same visitor and other metrics that GA does. So don’t waste your time trying to figure out which is “right” or “wrong”. Choose a source of truth, and use that consistently in your reporting.
- Sometimes it’s just… wrong. Glitch in the matrix, bad coding, slow pages. For whatever reason, sometimes there will be anomalies that you just can’t account for. Again, this isn’t accounting data, it’s a barometer. So don’t get too shaken up if you see data that just doesn’t look right.
If you would like help understanding your data better, getting more out of it, or making sure your analytics has been deployed properly,
contact us today. Our analytics experts will provide a free consultation.

Contact Us